No Comments

Single Tenant Net-Leased Trends Report | JAN-OCT 2017

The Wolfe Retail Group of Marcus & Millichap is proud to present our most recent Single-Tenant Net-Leased Trends Report, January-October 2017. This year, the retail landscape has experienced unprecedented change with major moves by online giants that included acquisitions, expansion, and offline territory encroachment. Meanwhile, moves by major offline players across the spectrum of categories have ranged from withering to aggressive action to take advantage of the opportunity presenting itself in the market. In this report, we look at cap rates for leading brands in several of the retail industry’s top-performing categories, as well as S&P credit ratings, estimated sales per square foot, and YOY average cap rates to identify possible trends.

Barry Wolfe, of the Wolfe Retail Group of Marcus & Millichap, provides a quick intro in this video.
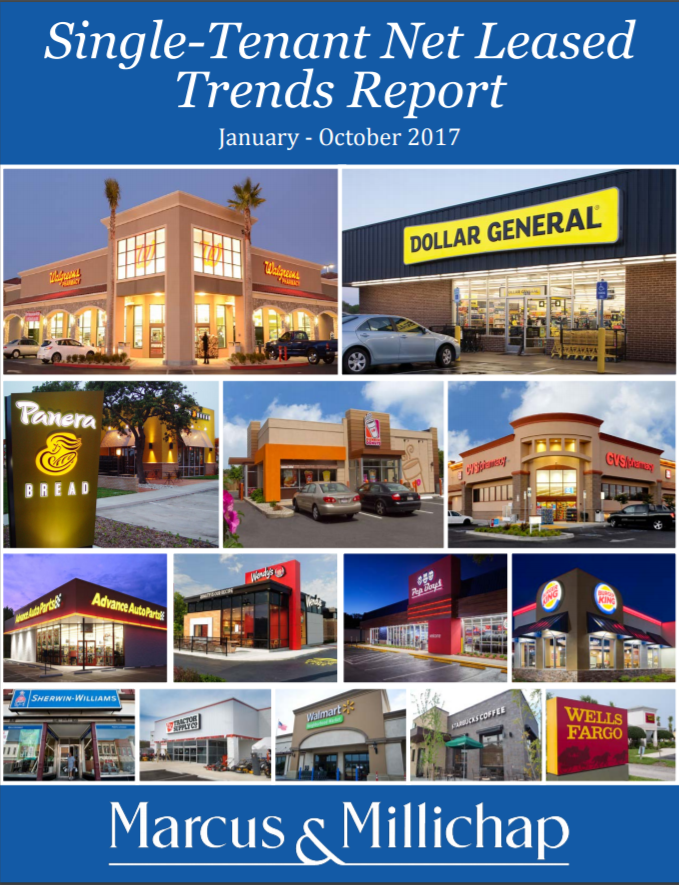
Segments include:

  • Beauty/Health/Drugstore
  • Dollar Stores
  • Auto Parts
  • Coffee/Bakery
  • Restaurants (QSR/Fast Casual)
  • Banks
  • Wireless
  • Others

Download the Single-Tenant Net Leased Trends Report now.

No Comments

2017 U.S. Retail Investment Forecast

Many unknowns assuredly await investors in the coming year. Prospects of consistent economic growth alongside rising interest rates, a potentially more aggressive Federal Reserve and a range of decisions expected to come from the White House and Capitol Hill merit scrutiny. We hope this report provides useful insights that will help our clients navigate the shifting landscape. Click below for this full report.
EXECUTIVE SUMMARY
National Retail Index (NRI)
  • Markets in Western states are well represented in this year’s National Retail Index (NRI). Seattle-Tacoma climbed two places to claim the top spot in the ranking, pushing last year’s highest-ranked market, San Francisco, down to the second position. Other Western metros in the top 10 are Los Angeles, Salt Lake City and Portland.
  • Raleigh announces its debut in the Index by securing the seventh position. Another Southern metro, Nashville, vaults from slightly outside the top 10 to the fi fth rung in 2017 behind projected low vacancy and a robust gain in the average rent.
  • Boston is this year’s highest-placed Eastern market, executing a seven-spot rise to the third position due to tight vacancy. New York City places close behind, while San Diego leads a contingent of four California metros to initiate the group of markets ranked from 11 to 20. The NRI concludes with Cleveland, Kansas City and St. Louis occupying the bottom three rungs of the 46 ranked markets
National Economy
  • A tightening labor market will trim job creation to 2 million new positions in 2017 from more than 2.2 million hires last year. Wage growth began to gather momentum last year and increases will continue this year as labor market slack tightens, promoting additional retail spending.
  • An increase in consumption and business output as well as more robust residential construction will support GDP growth in the 2.5 percent range in 2017. The availability of consumer and business credit is expanding.
  • Some uncertainty hangs over the economic outlook as the Trump administration begins to assemble an economic agenda. Tax cuts and infrastructure spending are assumed to be primary components of any economic legislation.
National Retail Overview
  • The retail sector continues to flourish despite the expansion of online retailing. Several value- and service-oriented retailers lead a list of scheduled store openings this year that will help generate 81 million square feet of net absorption and a reduction in the national vacancy rate to 5.1 percent.
  • The emergence of online distribution combines with tighter construction lending and investor caution to restrain development. This year’s projected completions of 49 million square feet mark a decline from 2016.
  • Changes are occurring at the property level, with many owners subdividing vacant anchor spaces to add restaurants and service providers as strategies to enhance property performance.
Capital Markets
  • Following an increase in the yield on the 10-year U.S. Treasury, investors have adapted their underwriting models to reflect arising interest rate environment. Debt markets remain liquid, providing solutions and sources for a range of capital needs.
  • Leverage on acquisition loans refl ects disciplined lender underwriting, with LTVs typically ranging from 55 percent to 65 percent for most retail properties. The combination of higher rates and conservative lender underwriting encouraged some investor caution that slowed deal fl ow in late 2016, a trend that will likely extend into 2017. Lenders will continue to scrutinize properties’ exposure to underperforming chains and vulnerability to e-commerce this year.
  • Banks stepped in to capture greater market share last year as CMBS issuance eased in response to new risk-retention standards under the Dodd-Frank law. The prospects of major changes to Dodd-Frank could materially change CMBS standards this year, but revisions will likely emerge slowly.
Retail Investment Outlook
  • Overall pricing and cap rates have surpassed pre-recession levels, driven by trends in primary markets. Many secondary and tertiary metros offer unique opportunities as prices remain below the prior peak, and these markets are eliciting interest from investors.
  • The rising popularity of online shopping is pushing investors to revise tenant mixes as a means to create additional value. Owners are turning to retailers that are difficult to disintermediate through online options.
No Comments

Cap Rate Report: July-Dec 2016

Many unknowns assuredly await investors in the coming year. Prospects of consistent economic growth alongside rising interest rates, a potentially more aggressive Federal Reserve and a range of decisions expected to come from the White House and Capitol Hill merit scrutiny. We hope this report provides useful insights that will help our clients navigate the shifting landscape. Click below for this full report.
EXECUTIVE SUMMARY
National Retail Index (NRI)
  • Markets in Western states are well represented in this year’s National Retail Index (NRI). Seattle-Tacoma climbed two places to claim the top spot in the ranking, pushing last year’s highest-ranked market, San Francisco, down to the second position. Other Western metros in the top 10 are Los Angeles, Salt Lake City and Portland.
  • Raleigh announces its debut in the Index by securing the seventh position. Another Southern metro, Nashville, vaults from slightly outside the top 10 to the fi fth rung in 2017 behind projected low vacancy and a robust gain in the average rent.
  • Boston is this year’s highest-placed Eastern market, executing a seven-spot rise to the third position due to tight vacancy. New York City places close behind, while San Diego leads a contingent of four California metros to initiate the group of markets ranked from 11 to 20. The NRI concludes with Cleveland, Kansas City and St. Louis occupying the bottom three rungs of the 46 ranked markets
National Economy
  • A tightening labor market will trim job creation to 2 million new positions in 2017 from more than 2.2 million hires last year. Wage growth began to gather momentum last year and increases will continue this year as labor market slack tightens, promoting additional retail spending.
  • An increase in consumption and business output as well as more robust residential construction will support GDP growth in the 2.5 percent range in 2017. The availability of consumer and business credit is expanding.
  • Some uncertainty hangs over the economic outlook as the Trump administration begins to assemble an economic agenda. Tax cuts and infrastructure spending are assumed to be primary components of any economic legislation.
National Retail Overview
  • The retail sector continues to fl ourish despite the expansion of online retailing. Several value- and service-oriented retailers lead a list of scheduled store openings this year that will help generate 81 million square feet of net absorption and a reduction in the national vacancy rate to 5.1 percent.
  • The emergence of online distribution combines with tighter construction lending and investor caution to restrain development. This year’s projected completions of 49 million square feet mark a decline from 2016.
  • Changes are occurring at the property level, with many owners subdividing vacant anchor spaces to add restaurants and service providers as strategies to enhance property performance.
Capital Markets
  • Following an increase in the yield on the 10-year U.S. Treasury, investors have adapted their underwriting models to reflect arising interest rate environment. Debt markets remain liquid, providing solutions and sources for a range of capital needs.
  • Leverage on acquisition loans refl ects disciplined lender underwriting, with LTVs typically ranging from 55 percent to 65 percent for most retail properties. The combination of higher rates and conservative lender underwriting encouraged some investor caution that slowed deal fl ow in late 2016, a trend that will likely extend into 2017. Lenders will continue to scrutinize properties’ exposure to underperforming chains and vulnerability to e-commerce this year.
  • Banks stepped in to capture greater market share last year as CMBS issuance eased in response to new risk-retention standards under the Dodd-Frank law. The prospects of major changes to Dodd-Frank could materially change CMBS standards this year, but revisions will likely emerge slowly.
Retail Investment Outlook
  • Overall pricing and cap rates have surpassed pre-recession levels, driven by trends in primary markets. Many secondary and tertiary metros offer unique opportunities as prices remain below the prior peak, and these markets are eliciting interest from investors.
  • The rising popularity of online shopping is pushing investors to revise tenant mixes as a means to create additional value. Owners are turning to retailers that are difficult to disintermediate through online options.