No Comments

Single Tenant Net-Leased Trends Report | JAN-OCT 2017

The Wolfe Retail Group of Marcus & Millichap is proud to present our most recent Single-Tenant Net-Leased Trends Report, January-October 2017. This year, the retail landscape has experienced unprecedented change with major moves by online giants that included acquisitions, expansion, and offline territory encroachment. Meanwhile, moves by major offline players across the spectrum of categories have ranged from withering to aggressive action to take advantage of the opportunity presenting itself in the market. In this report, we look at cap rates for leading brands in several of the retail industry’s top-performing categories, as well as S&P credit ratings, estimated sales per square foot, and YOY average cap rates to identify possible trends.

Barry Wolfe, of the Wolfe Retail Group of Marcus & Millichap, provides a quick intro in this video.
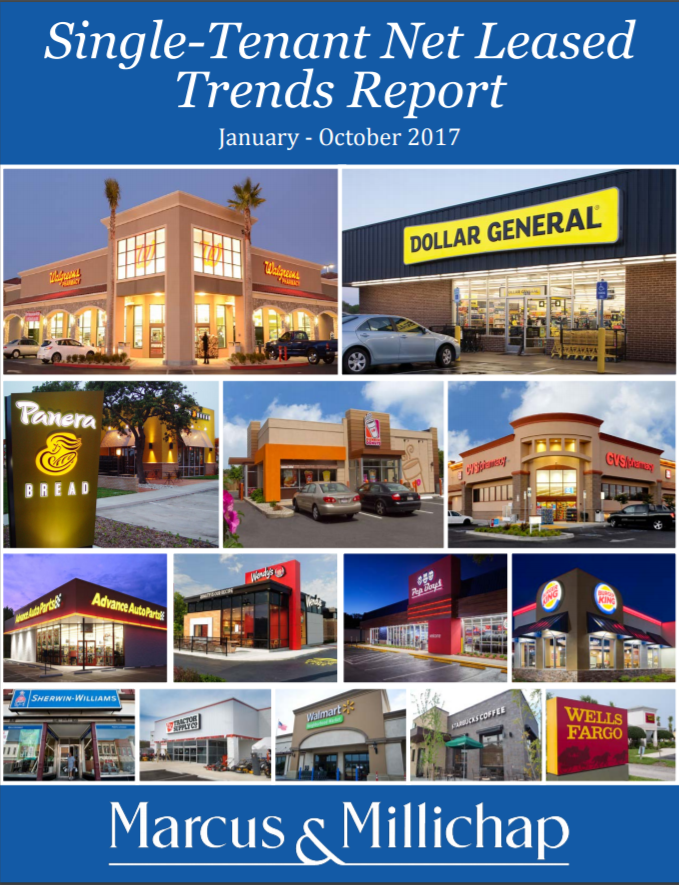
Segments include:

  • Beauty/Health/Drugstore
  • Dollar Stores
  • Auto Parts
  • Coffee/Bakery
  • Restaurants (QSR/Fast Casual)
  • Banks
  • Wireless
  • Others

Download the Single-Tenant Net Leased Trends Report now.

No Comments

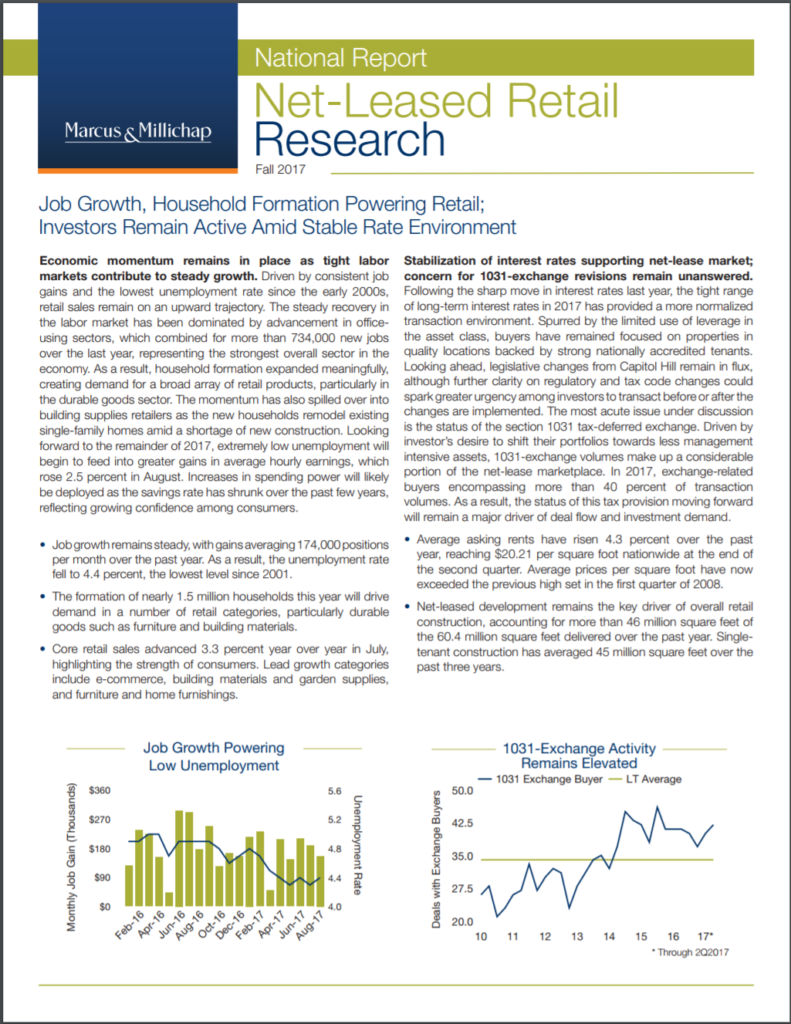
Net-Leased Retail Research (Fall 2017)

Marcus & Millichap recently released the Net-Leased Retail Research Fall 2017 Report which looks at the current net-lease landscape including key indicators such as employment, 1031-exchange activity, retail sales growth, and the 10-year Treasury. Following are key highlights I gathered from the report:

  • Job growth remains steady, with gains averaging 174,000 positions per month over the past year. This has resulted in the unemployment rate reaching the lowest level since 2001.
  • Net-leased development remains the predominant sector of overall retail construction. Of the approximately 60.4 million square feet of retail space delivered over the past year, more than 46 million square feet was composed of single tenant net-leased retail. Dollar stores, quick-service restaurants, and pharmacies are the single-tenant concepts that have experienced the most construction activity in 2017.
  • Driven by investor desire to shift their portfolios toward less management-intensive assets, 1031-exchange volumes make up a considerable portion of the net-lease marketplace. So far in 2017, exchange-related buyers encompass more than 40 percent of transaction volumes. As a result, the status of this tax provision moving forward will remain a major driver of deal flow and investment demand. Any potential changes to the tax code that significantly impact 1031 Exchanges would have a serious impact on this sector so it is certainly something to watch closely.
  • Overall, leverage on acquisition loans has continued to reflect disciplined underwriting, with LTVs typically ranging from 60 percent to 70 percent for most retail properties. Going forward, The Federal Reserve’s plans to normalize its balance sheet will place upward pressure on interest rates.

The Net Lease Report also includes a summary of credit rating, number of locations and range of cap rates related to sales by several different brands and sectors. Download the report below. As always, at the Wolfe Retail Group of Marcus & Millichap, we are available to discuss this information in depth, including any impact this may have on any of your projects. We remain optimistic that 2018 will be another strong year for our sector of the commercial real estate industry. Feel free to message me via LinkedIn.