No Comments

Wolfe Pack Retail Sales Update | August 2019

August retail sales grew 4.6% year-over-year (unadjusted), and up by 0.4% month-over-month, excluding automobile dealers, gasoline stations and restaurants. 

As of August, the three-month moving average was up 4.1% year-over-year versus 3.5% in July. 

While retail trends continue looking good, tariff talks are having an impact.

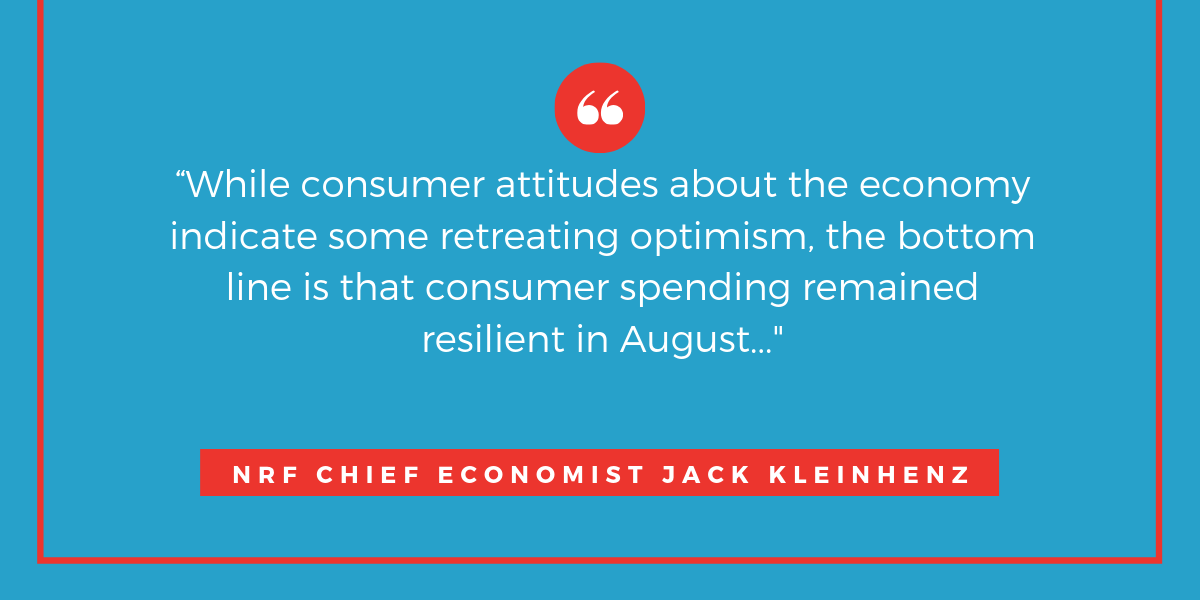
“While consumer attitudes about the economy indicate some retreating optimism, the bottom line is that consumer spending remained resilient in August and continued to be a key contributor to U.S. economic growth,” NRF Chief Economist Jack Kleinhenz said. “Trends remain strong, but August grew somewhat slower than July, which could reflect consumers’ concerns about the unpredictability of trade policy. It is too early to assess the impact of the new tariffs that took effect at the beginning of this month, but they do present downside risks to household spending.”’

YOY August Winners (in descending order):

  • Grocery and beverage stores were up 4.9% YOY but down 0.2 percent month-over-month seasonally adjusted.
  • Sporting goods stores were up 3.8% YOY and up 0.9 percent month-over-month seasonally adjusted.
  • Health and personal care stores were up 2.9% YOY and up 0.7 percent month-over-month seasonally adjusted.
  • Clothing and clothing accessory stores were up 2.3% YOY but down 0.9 percent month-over-month seasonally adjusted.
  • General merchandise stores were up 2.2% YOY but down 0.3 percent month-over-month seasonally adjusted.

YOY Losers:

  • Electronics and appliance stores were down 2.9% YOY and unchanged month-over-month seasonally adjusted.
  • Building materials and garden supply stores were down 0.6% YOY but up 1.4 percent month-over-month seasonally adjusted.
  • Furniture and home furnishings stores were down 0.1% YOY and down 0.5 percent month-over-month seasonally adjusted.

Online & Other Non-Store Watch:

  • Online and other non-store sales were up 14.3 percent year-over-year and up 1.6 percent month-over-month seasonally adjusted.

What do you think about the latest numbers and category trends?
All real estate investments carry risks. Nothing in this post shall be construed as tax or investment advice. A buyer and their tax, financial, legal, and construction advisors should conduct a careful, independent investigation of any property to determine to your satisfaction the suitability of the property for your needs.

No Comments

Sale-Leasebacks Explained

What are sale-leasebacks?

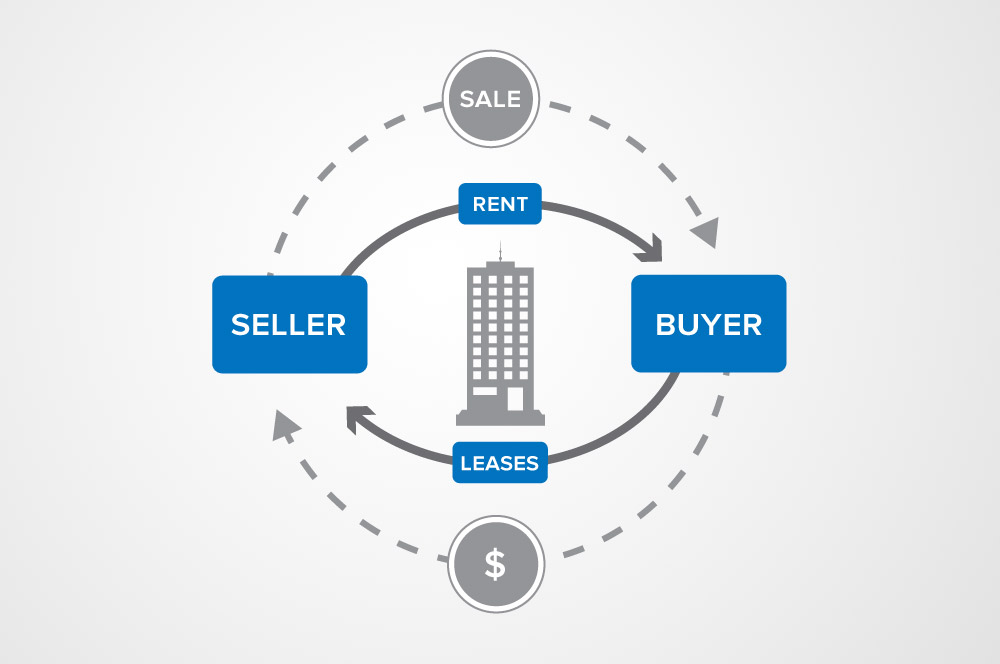
If you’re a commercial property owner and are looking to expand your business, a sale-leaseback may be an option for you.  A sale-leaseback is when a property owner, who is also an operator, sells their property but continues to operate it by leasing back the property from the new owner.

A sale-leaseback arrangement is useful when a property owner needs or wants to gain access to cash, or wants to divest from a property but maintain the existing operation on the site. The sale-leaseback option will allow the property owner to access the equity in their property and reinvest the funds in the business. The lease agreement is executed at the same time as the sale. The seller of the property becomes the tenant while the buyer becomes the landlord.

SELLER BENEFITS

The transaction allows the business and property owner to increase their liquidity while reducing their debt. In addition, the immediate access to capital allows sellers to:

  • Add additional units
  • Upgrade equipment
  • Invest in marketing, new team members, inventory, etc.
  • Pay off business debt

Plus, the Seller/Operator:

  • Can write off the entire lease payment instead of just the interest on the mortgage
  • Is able to remain in the same location without incurring moving costs
  • Can improve their income statement and balance sheet
    • For example, if the property is sold any existing loan will be removed from the balance sheet
    • Interest and depreciation are also removed from the property owner’s financials
  • Can benefit from a lower cost of funds than debt financing through off-balance sheet financing
    • Since sale-leaseback investors get the tax benefits of owning and depreciating the property, the seller can often be successful in obtaining a lower cost for capital than the cost for debt.

Seller Benefits & Opportunities Snapshot

  • Access to capital
  • Liquidity
  • Stronger balance sheet
  • Tax benefits
  • Lower cost of capital
  • Opportunity to grow your business
  • Reinvest in your business

BUYER BENEFITS

Buyer Benefits & Opportunities

  • The buyer and the seller have the unique opportunity to negotiate the lease with terms that meet their specific needs from the rental rate to a division in management responsibilities
  • The buyer can ask for the opportunity to review the tenant’s financials to gauge their financial health and stability. In the majority of lease agreements already in place at the time of the purchase of a property, the buyer has less negotiating power to request access to financials.
  • The property is already improved to meet the needs of the tenant

Attention Restaurant Owners:

Listen to my conversation with Jim White of Katz Sapper & Miller on how restaurant owners, who also own their properties, can benefit from sale-leasebacks.
This Episode: ‘Grow Your Restaurant’ Podcast with Barry Wolfe of Marcus & Millichap

All real estate investments carry risks. Nothing in this post shall be construed as tax or investment advice. A buyer and their tax, financial, legal, and construction advisors should conduct a careful, independent investigation of any property to determine to your satisfaction the suitability of the property for your needs.
#NetLeasePro #NNN #CRE #Retail #Sale-Leaseback#NetLease #CREInvesting #STNL #BarryWolfe

No Comments

1031 Exchanges Explained

1031 Exchanges Explained

What is a 1031 Exchange?

A 1031 Exchange allows you to defer the taxes from a commercial property sale by reinvesting the proceeds from the sale in “like-kind” property, within the specified time frames, potentially saving you tens of thousands of dollars.

There are two critical deadlines that must be met.

Deadline #1: The 45-Day Property Identification Period

Within 45 days of the sale of your property, you MUST:

  • Identify a replacement property in writing to an intermediary, specifying the property you want to acquire.
    • You can identify three potential properties for the exchange as long as you eventually close on at least one of them.
      • The identification of the property must be specific and not ambiguous.
    • As an alternative, the 200% rule allows you to designate more than three properties, which may add up to a maximum of 200% of the exchange value.
  • The proceeds from the sale of the property must be held by a qualified intermediary, also known as an exchange accommodator.
    • To avoid taxes, the total value of the replacement property or properties must be equal to or greater than the relinquished property.  

Deadline #2: The 180-Day Exchange Period

  • You MUST close on the new property or properties within 180 days of the sale of the old or relinquished property.
  • The countdown on both deadlines begins simultaneously when the sale of your property closes.
  • There’s no limit to the number of times you can do an exchange so you only have to pay taxes on the final sale for which you want to realize or cash-out on the gains.

If your debt decreases in the exchange, the difference is treated as income–sometimes called boot–and is taxable as is any cash you may have left over after the exchange

13942691

NOTE: 1031 Exchanges can only be executed with investment and business property, not primary residences.

Q&A

  • What is a like-kind property?  

According to the IRS, properties are of like-kind if they’re of the same nature or character, even if they differ in grade or quality. Real properties generally are of like-kind, regardless of whether they’re improved or unimproved.


  • How do I find a like-kind property within 45 days?

This can be tricky, which is why it is recommended that you work with a broker who has expertise in both the type of properties you are looking for and 1031 Exchanges


  • Why is broker expertise important?

There are thousands of properties listed, many expired or no longer available. Some have encumbrances or other issues that could delay the process impacting your ability to close or your timeline, or both, not to mention the hours of your own time you’ll have to put in to do the research.  An experienced broker can take all of that stress off your plate and provide you with a fully researched list of viable properties that meet or exceed your criteria.

All real estate investments carry risks. Nothing in this post shall be construed as tax or investment advice. A buyer and their tax, financial, legal, and construction advisors should conduct a careful, independent investigation of any property to determine to your satisfaction the suitability of the property for your needs.

#NetLeasePro #NNN #CRE #Retail #1031-Exchanges#NetLease #CREInvesting #STNL #BarryWolfe

No Comments

What Is A Single-Tenant Net-Leased Property?

What Is A Single-Tenant Net-Leased Property?

A STNL Q&A CHEAT SHEET


Q: What is a single-tenant property?

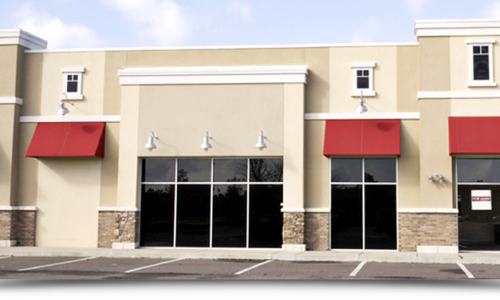
A single-tenant property is a freestanding retail, office, medical, or industrial building that is leased and occupied by one tenant, user, or company.


Q: What is a net lease?

A net lease is a type of commercial lease between a tenant and property owner where, in addition to paying the rent, the tenant–and not the landlord–is responsible for paying the rent as well as some or all of the building’s operating expenses such as insurance, taxes, maintenance, repairs, and utilities, depending on the type of net lease agreement.

The three most common types of net leases are:

  • Single Net Lease: Tenant pays Rent + Taxes
  • Double Net Lease: Tenant pays Rent + Taxes + Insurance
  • Triple Net Lease: Tenant pays Rent + Taxes + Insurance + Maintenance/Operating Expenses


Q: Which one gives me the most freedom?

The triple net lease affords the property owner the most freedom and flexibility.


Want to learn more? Watch our video here!


All real estate investments carry risks. Nothing in this post shall be construed as tax or investment advice. A buyer and their tax, financial, legal, and construction advisors should conduct a careful, independent investigation of any property to determine to your satisfaction the suitability of the property for your needs.
#NetLeasePro #NNN #CRE #Retail #Single-Tenant #NetLease #CREInvesting #STNL #BarryWolfe

No Comments

The Time/Money/Risk Benefits of Triple Net Leases

The Time/Money/Risk Benefits of Triple Net Leases


Investors will often hear that there are many benefits to triple net leases but for those who may be exchanging from multi-family, land, or manufactured home parks—or new investors that may have inherited property—the benefits of the triple-net, may not be clear.

A net lease is a type of commercial lease between a tenant and property owner.  The three most common types of net leases are:

  • Single Net Lease: Tenant pays Rent + Taxes
  • Double Net Lease: Tenant pays Rent + Taxes + Insurance
  • Triple Net Lease: Tenant pays Rent + Taxes + Insurance + Maintenance/Operating Expenses

For the purposes of this article we will conduct a Time/Money/Risk analysis on the triple net lease, which is where, in addition to paying the rent, the tenant-–and not the landlord–-is responsible for paying some or all of the building’s operating expenses such as insurance, taxes, maintenance, repairs, and utilities.

TIME:

Freedom

  • The triple net lease, whether on a single-tenant or multi-tenant property, affords the property owner the most freedom in terms of time and flexibility thanks to its hands-off management structure.

Hands-Off Management

  • With NNN properties, landlords can avoid the typical property management obligations and hassles to enjoy more time to dedicate to things they prefer to do. As noted earlier, in a triple net lease, also known as NNN, the tenant pays for and manages all of the building’s operating expenses, real estate taxes, insurance, and maintenance, freeing the property owner from the responsibility and hassle.

Assets That Hold & Grow Value

  • Triple net lease properties often attract corporate-backed credit tenants. Long-term leases with credit tenants allow your investment to grow and weather economic cycles.


MONEY:

Steady & Predictable Passive Income

  • Triple net properties allow property owners to receive a steady and predictable stream of income from a reliable source every month with minimal management and attention.

Reliable Source of Income

  • Single-tenant net-leased properties attract an array of corporate-backed credit tenants that provide greater long-term reliability.

Owner-Friendly Leases

  • Triple net leases often have built-in increases that offer opportunities for better planning for both the tenant and landlord, and provide a hedge against long-term inflation risk. In addition, they also often have options to extend in five or 10-year increments.

Defer Taxes at the Time of the Sale

  • When a property owner is ready to sell, 1031 Exchanges allow them to defer the capital gains on the property


RISK:

Less Risk

  • Triple net-leased properties tend to offer less risk than other commercial real estate investments that have tenants with non-investment grade credit profiles, although no investment is risk-free.

Longer Leases / More Stability

  • Triple net-leased properties have longer-term leases that provide greater stability and reduce risk and worry.


Ready to invest in a triple net property? Contact us at: 954-245-3416.


Learn more about NNN and single-tenant net-leased properties. Watch our video


All real estate investments carry risks. Nothing in this post shall be construed as tax or investment advice. A buyer and their tax, financial, legal, and construction advisors should conduct a careful, independent investigation of any property to determine to your satisfaction the suitability of the property for your needs.

#NetLeasePro #NNN #CRE #Retail #Single-Tenant #NetLease #CREInvesting #STNL #BarryWolfe

No Comments

Walmart Vs. Amazon – The Battle of The Retail Giants

Walmart Vs. Amazon – The Battle of The Retail Giants

What’s their next move?

Post by Barry Wolfe

Did you see this one coming?

Sam’s Club is building a small-format concept that will be “centered on convenience and a digital experience” stocking only 1,000 to 2,000 skus. (Read story here: http://www.supermarketnews.com/retail-financial/sam-s-club-develops-small-format-concept)

On the same day, it was revealed that the company opened the first of its new e-commerce fulfillment centers in Memphis, TN.

Interestingly, both announcements were made by Jamie Iannone, CEO of SamsClub.com and EVP of membership and technology.

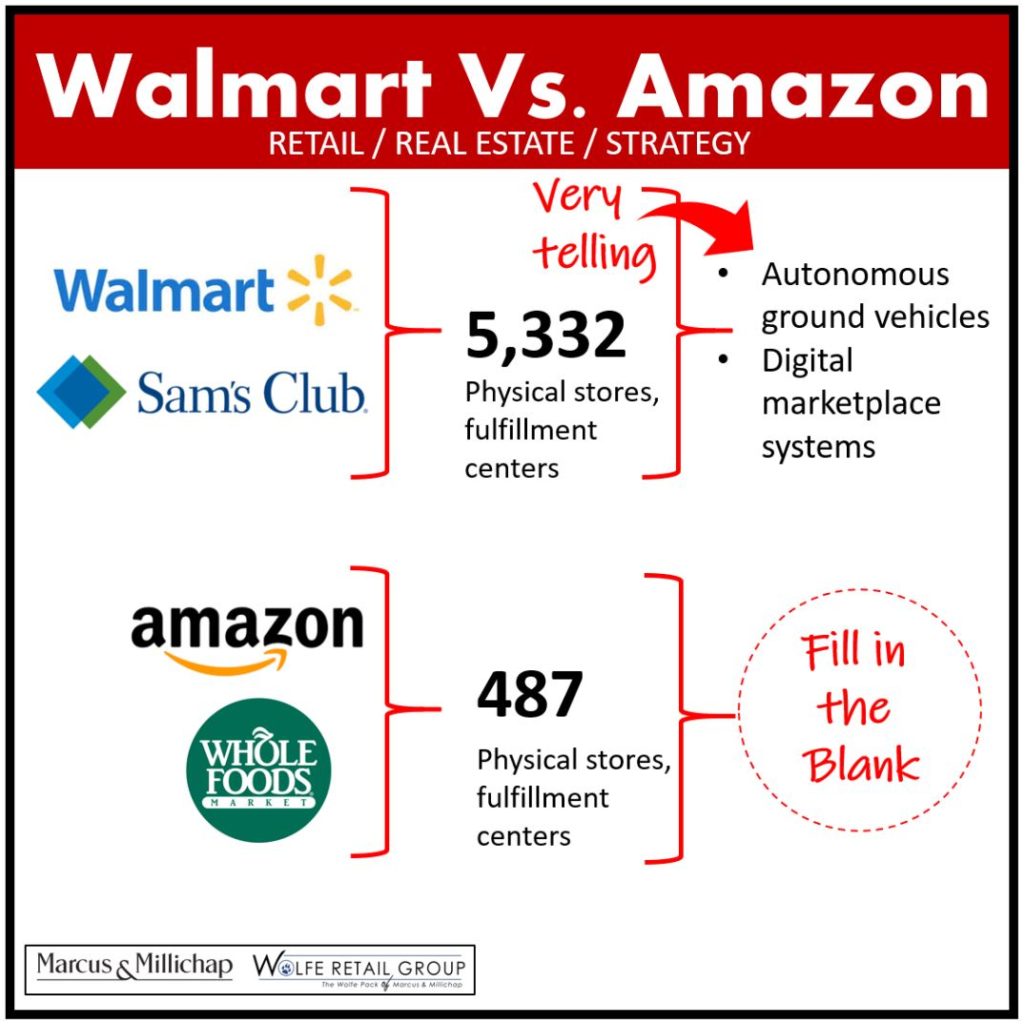
I see this as a sign of things to come as e-commerce, fulfillment centers and brick-and-mortar locations merge in an omnichanneling landscape. In so many ways, Walmart is ahead of the game on this one. They have 660 Sam’s Clubs ands 4,672 Walmarts in the U.S. for a total of 5,332 sites. Amazon has 75 fulfillment centers and 412 Whole Foods.

This tells me that Walmart is in an excellent position to achieve penetration across a broader spectrum of markets, those that are e-commerce-friendly to slow adapters, from the coasts to rural areas. And, it also tells me that Amazon isn’t likely to sit by on such an unbalanced equation. They are likely to make a move that will allow them deeper market penetration, faster deployment, and access at a localized level. What will give them that advantage?

My inclination is toward drugstores. They’ve tackled food through Whole Foods, whose consumers mirrored their own customer profile and gave them grocery market entry via a physical location in a demographically-aligned trade area.

Next, would be medicine/drugstores/beauty. I’ve said this before as it gives them entry into a growing market segment (beauty) while gaining a foothold in a recession-resistant category (medical/drugstores). I’m not the only one thinking this is their next move. CVS is rolling out delivery for prescriptions and some over-the-counter medicines as it is said to be bracing for Amazon’s possible disruption. (Read more here: https://www.cnbc.com/2018/06/19/cvs-starts-drug-delivery-as-it-braces-for-expected-amazon-disruption.htmlThe drugstore’s merger with Aetna makes it an even more interesting player as Amazon has been making various supply-side moves.

Interestingly, Walmart just recently filed for several patents including a patents system for accessing medical records stored on a #blockchain, and just last month, Walmart was awarded two patents; one for a digital marketplace system that customers may use to resell items and the other geared towards facilitating customer deliveries to restricted areas using autonomous ground vehicles. Read full story here: https://www.ccn.com/walmart-patents-system-for-accessing-medical-records-stored-on-a-blockchain/

What will be Walmart’s next move? What will be Amazon’s next play?

Let me know your thoughts here: https://www.linkedin.com/feed/update/urn:li:activity:6415976467259224064


No Comments

Net-Leased Retail Research (Fall 2017)

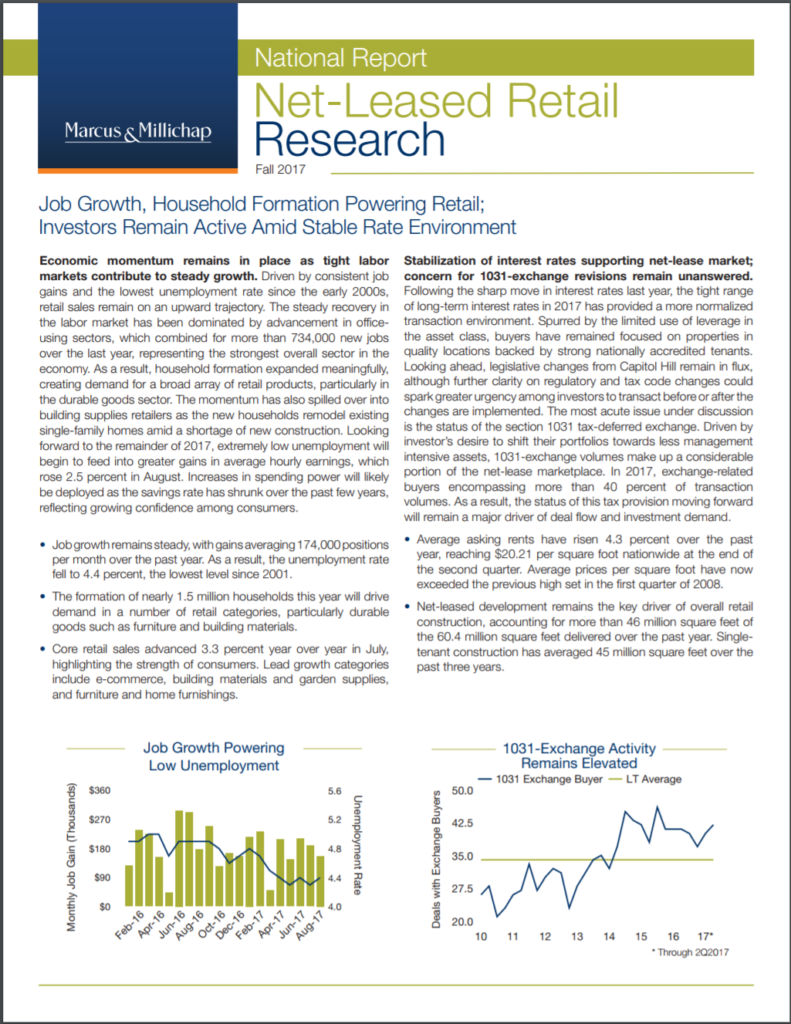
Marcus & Millichap recently released the Net-Leased Retail Research Fall 2017 Report which looks at the current net-lease landscape including key indicators such as employment, 1031-exchange activity, retail sales growth, and the 10-year Treasury. Following are key highlights I gathered from the report:

  • Job growth remains steady, with gains averaging 174,000 positions per month over the past year. This has resulted in the unemployment rate reaching the lowest level since 2001.
  • Net-leased development remains the predominant sector of overall retail construction. Of the approximately 60.4 million square feet of retail space delivered over the past year, more than 46 million square feet was composed of single tenant net-leased retail. Dollar stores, quick-service restaurants, and pharmacies are the single-tenant concepts that have experienced the most construction activity in 2017.
  • Driven by investor desire to shift their portfolios toward less management-intensive assets, 1031-exchange volumes make up a considerable portion of the net-lease marketplace. So far in 2017, exchange-related buyers encompass more than 40 percent of transaction volumes. As a result, the status of this tax provision moving forward will remain a major driver of deal flow and investment demand. Any potential changes to the tax code that significantly impact 1031 Exchanges would have a serious impact on this sector so it is certainly something to watch closely.
  • Overall, leverage on acquisition loans has continued to reflect disciplined underwriting, with LTVs typically ranging from 60 percent to 70 percent for most retail properties. Going forward, The Federal Reserve’s plans to normalize its balance sheet will place upward pressure on interest rates.

The Net Lease Report also includes a summary of credit rating, number of locations and range of cap rates related to sales by several different brands and sectors. Download the report below. As always, at the Wolfe Retail Group of Marcus & Millichap, we are available to discuss this information in depth, including any impact this may have on any of your projects. We remain optimistic that 2018 will be another strong year for our sector of the commercial real estate industry. Feel free to message me via LinkedIn.


No Comments

2017 U.S. Retail Investment Forecast

Many unknowns assuredly await investors in the coming year. Prospects of consistent economic growth alongside rising interest rates, a potentially more aggressive Federal Reserve and a range of decisions expected to come from the White House and Capitol Hill merit scrutiny. We hope this report provides useful insights that will help our clients navigate the shifting landscape. Click below for this full report.
EXECUTIVE SUMMARY
National Retail Index (NRI)
  • Markets in Western states are well represented in this year’s National Retail Index (NRI). Seattle-Tacoma climbed two places to claim the top spot in the ranking, pushing last year’s highest-ranked market, San Francisco, down to the second position. Other Western metros in the top 10 are Los Angeles, Salt Lake City and Portland.
  • Raleigh announces its debut in the Index by securing the seventh position. Another Southern metro, Nashville, vaults from slightly outside the top 10 to the fi fth rung in 2017 behind projected low vacancy and a robust gain in the average rent.
  • Boston is this year’s highest-placed Eastern market, executing a seven-spot rise to the third position due to tight vacancy. New York City places close behind, while San Diego leads a contingent of four California metros to initiate the group of markets ranked from 11 to 20. The NRI concludes with Cleveland, Kansas City and St. Louis occupying the bottom three rungs of the 46 ranked markets
National Economy
  • A tightening labor market will trim job creation to 2 million new positions in 2017 from more than 2.2 million hires last year. Wage growth began to gather momentum last year and increases will continue this year as labor market slack tightens, promoting additional retail spending.
  • An increase in consumption and business output as well as more robust residential construction will support GDP growth in the 2.5 percent range in 2017. The availability of consumer and business credit is expanding.
  • Some uncertainty hangs over the economic outlook as the Trump administration begins to assemble an economic agenda. Tax cuts and infrastructure spending are assumed to be primary components of any economic legislation.
National Retail Overview
  • The retail sector continues to flourish despite the expansion of online retailing. Several value- and service-oriented retailers lead a list of scheduled store openings this year that will help generate 81 million square feet of net absorption and a reduction in the national vacancy rate to 5.1 percent.
  • The emergence of online distribution combines with tighter construction lending and investor caution to restrain development. This year’s projected completions of 49 million square feet mark a decline from 2016.
  • Changes are occurring at the property level, with many owners subdividing vacant anchor spaces to add restaurants and service providers as strategies to enhance property performance.
Capital Markets
  • Following an increase in the yield on the 10-year U.S. Treasury, investors have adapted their underwriting models to reflect arising interest rate environment. Debt markets remain liquid, providing solutions and sources for a range of capital needs.
  • Leverage on acquisition loans refl ects disciplined lender underwriting, with LTVs typically ranging from 55 percent to 65 percent for most retail properties. The combination of higher rates and conservative lender underwriting encouraged some investor caution that slowed deal fl ow in late 2016, a trend that will likely extend into 2017. Lenders will continue to scrutinize properties’ exposure to underperforming chains and vulnerability to e-commerce this year.
  • Banks stepped in to capture greater market share last year as CMBS issuance eased in response to new risk-retention standards under the Dodd-Frank law. The prospects of major changes to Dodd-Frank could materially change CMBS standards this year, but revisions will likely emerge slowly.
Retail Investment Outlook
  • Overall pricing and cap rates have surpassed pre-recession levels, driven by trends in primary markets. Many secondary and tertiary metros offer unique opportunities as prices remain below the prior peak, and these markets are eliciting interest from investors.
  • The rising popularity of online shopping is pushing investors to revise tenant mixes as a means to create additional value. Owners are turning to retailers that are difficult to disintermediate through online options.